Build cache performance
The sole reason to use any build cache is to make builds faster. But how much faster can you go when using the cache? Measuring the impact is both important and complicated, as cache performance is determined by many factors. Performing measurements of the cache’s impact can validate the extra effort (work, infrastructure) that is required to start using the cache. These measurements can later serve as baselines for future improvements, and to watch for signs of regressions.
| Proper configuration and maintenance of a build can improve caching performance in a big way. |
Fully cached builds
The most straightforward way to get a feel for what the cache can do for you is to measure the difference between a non-cached build and a fully cached build. This will give you the theoretical limit of how fast builds with the cache can get, if everything you’re trying to build has already been built. The easiest way to measure this is using the local cache:
-
Clean the cache directory to avoid any hits from previous builds (
rm -rf $GRADLE_USER_HOME/caches/build-cache-*) -
Run the build (e.g.
./gradlew --build-cache clean assemble), so that all the results from cacheable tasks get stored in the cache. -
Run the build again (e.g.
./gradlew --build-cache clean assemble); depending on your build, you should see many of the tasks being retrieved from the cache. -
Compare the execution time for the two builds
| You may encounter a few cached tasks even in the first of the two builds, where no previously cached results should be available. This can happen if you have tasks in your build that are configured to produce the same results from the same inputs; in such a case once one of these tasks has finished, Gradle will simply reuse its output for the rest of the tasks. |
Normally, your fully cached build should be significantly faster than the clean build: this is the theoretical limit of how much time using the build cache can save on your particular build.
You usually don’t get the achievable performance gains on the first try, see finding problems with task output caching.
As your build logic is evolving and changing it is also important to make sure that the cache effectiveness is not regressing.
A Build Scan provides a detailed performance breakdown which show you how effectively your build is using the build cache:
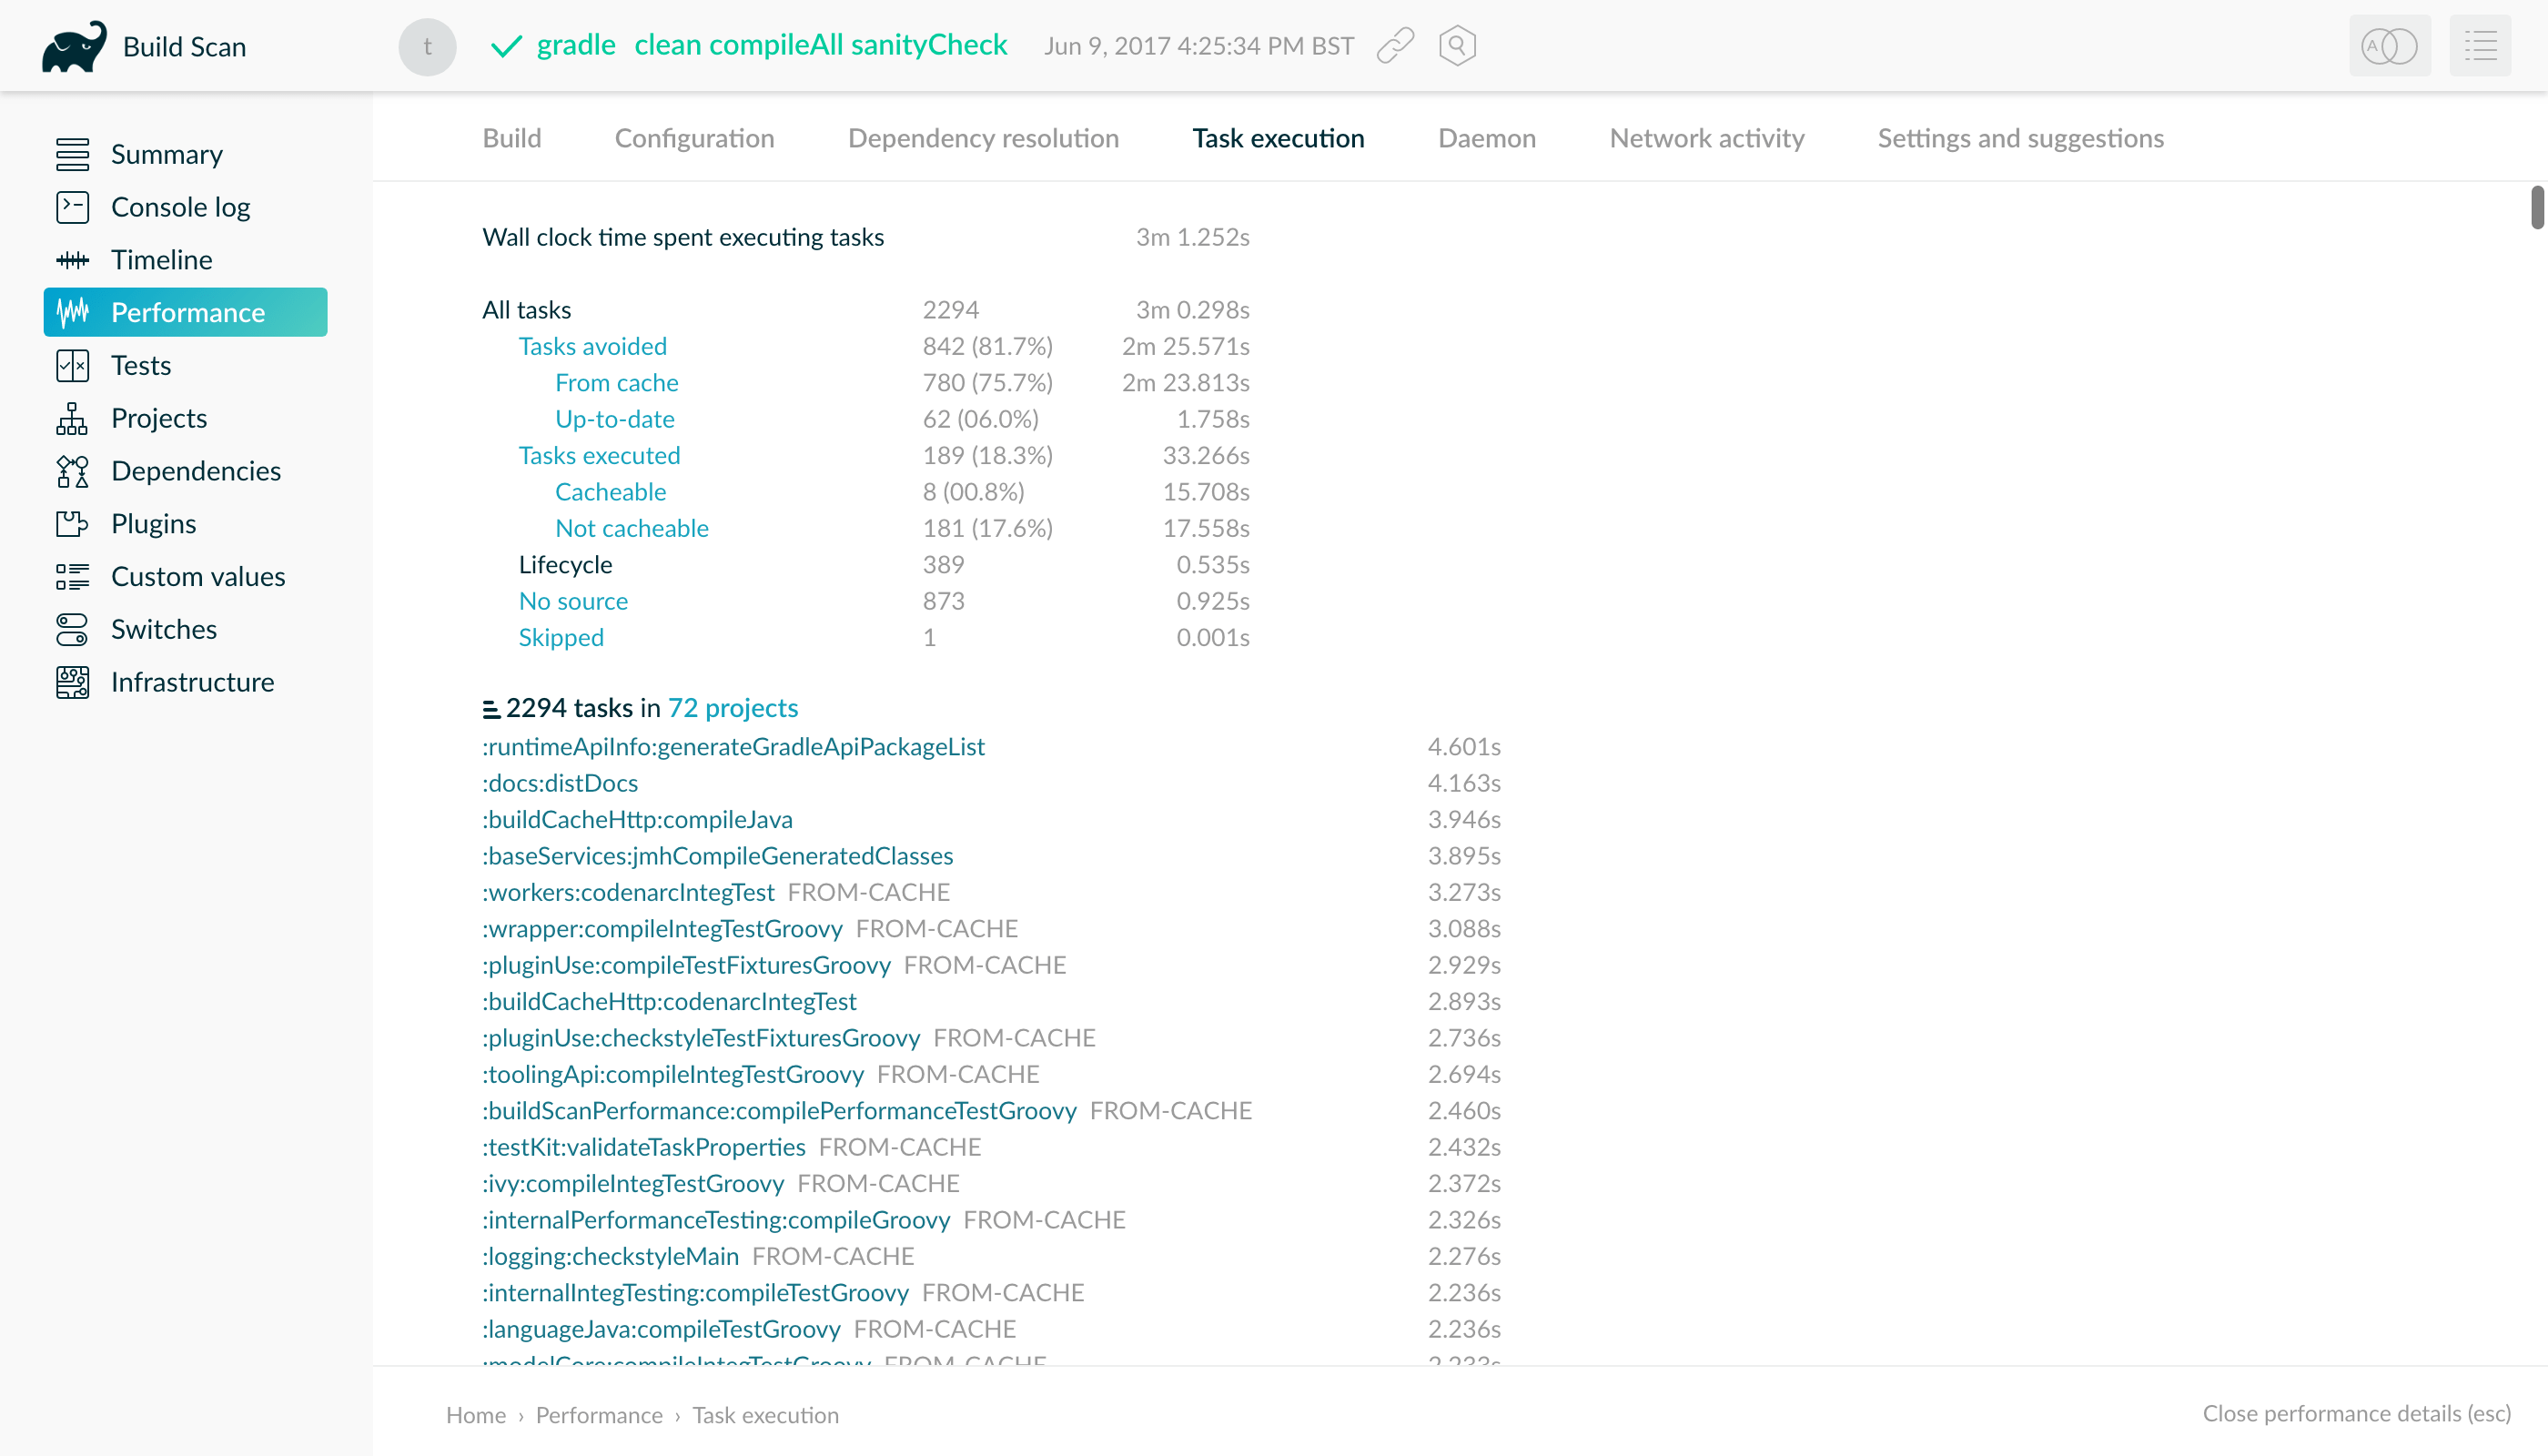
Fully cached builds occur in situations when developers check out the latest from version control and then build, for example to generate the latest sources they need in their IDE. The purpose of running most builds though is to process some new changes. The structure of the software being built (how many modules are there, how independent are its parts etc.), and the nature of the changes themselves ("big refactor in the core of the system" vs. "small change to a unit test" etc.) strongly influence the performance gains delivered by the build cache. As developers tend to submit different kinds of changes over time, caching performance is expected to vary with each change. As with any cache, the impact should therefore be measured over time.
In a setup where a team uses a shared cache backend, there are two locations worth measuring cache impact at: on CI and on developer machines.
Cache impact on CI builds
The best way to learn about the impact of caching on CI is to set up the same builds with the cache enabled and disabled, and compare the results over time. If you have a single Gradle build step that you want to enable caching for, it’s easy to compare the results using your CI system’s built-in statistical tools.
Measuring complex pipelines may require more work or external tools to collect and process measurements. It’s important to distinguish those parts of the pipeline that caching has no effect on, for example, the time builds spend waiting in the CI system’s queue, or time taken by checking out source code from version control.
When using Develocity, you can use the Export API to access the necessary data and run your analytics. Develocity provides much richer data compared to what can be obtained from CI servers. For example, you can get insights into the execution of single tasks, how many tasks were retrieved from the cache, how long it took to download from the cache, the properties that were used to calculate the cache key and more. When using your CI servers built in functions, you can use statistic charts if you use Teamcity for your CI builds. Most of time you will end up extracting data from your CI server via the corresponding REST API (see Jenkins remote access API and Teamcity REST API).
Typically, CI builds above a certain size include parallel sections to utilize multiple agents. With parallel pipelines you can measure the wall-clock time it takes for a set of changes to go from having been pushed to version control to being built, verified and deployed. The build cache’s effect in this case can be measured in the reduction of the time developers have to wait for feedback from CI.
You can also measure the cumulative time your build agents spent building a changeset, which will give you a sense of the amount of work the CI infrastructure has to exert. The cache’s effect here is less money spent on CI resources, as you don’t need as many CI agents to maintain the same number of changes built.
If you want to look at the measurement for the Gradle build itself you can have a look at the blog post "Introducing the build cache".
Measuring developer builds
Gradle’s build cache can be very useful in reducing CI infrastructure cost and feedback time, but it usually has the biggest impact when developers can reuse cached results in their local builds. This is also the hardest to quantify for a number of reasons:
-
developers run different builds
-
developers can have different hardware, or have different settings
-
developers run all kinds of other things on their machines that can slow them down
When using Develocity you can use the Export API to extract data about developer builds, too. You can then create statistics on how many tasks were cached per developer or build. You can even compare the times it took to execute the task vs loading it from the cache and then estimate the time saved per developer.
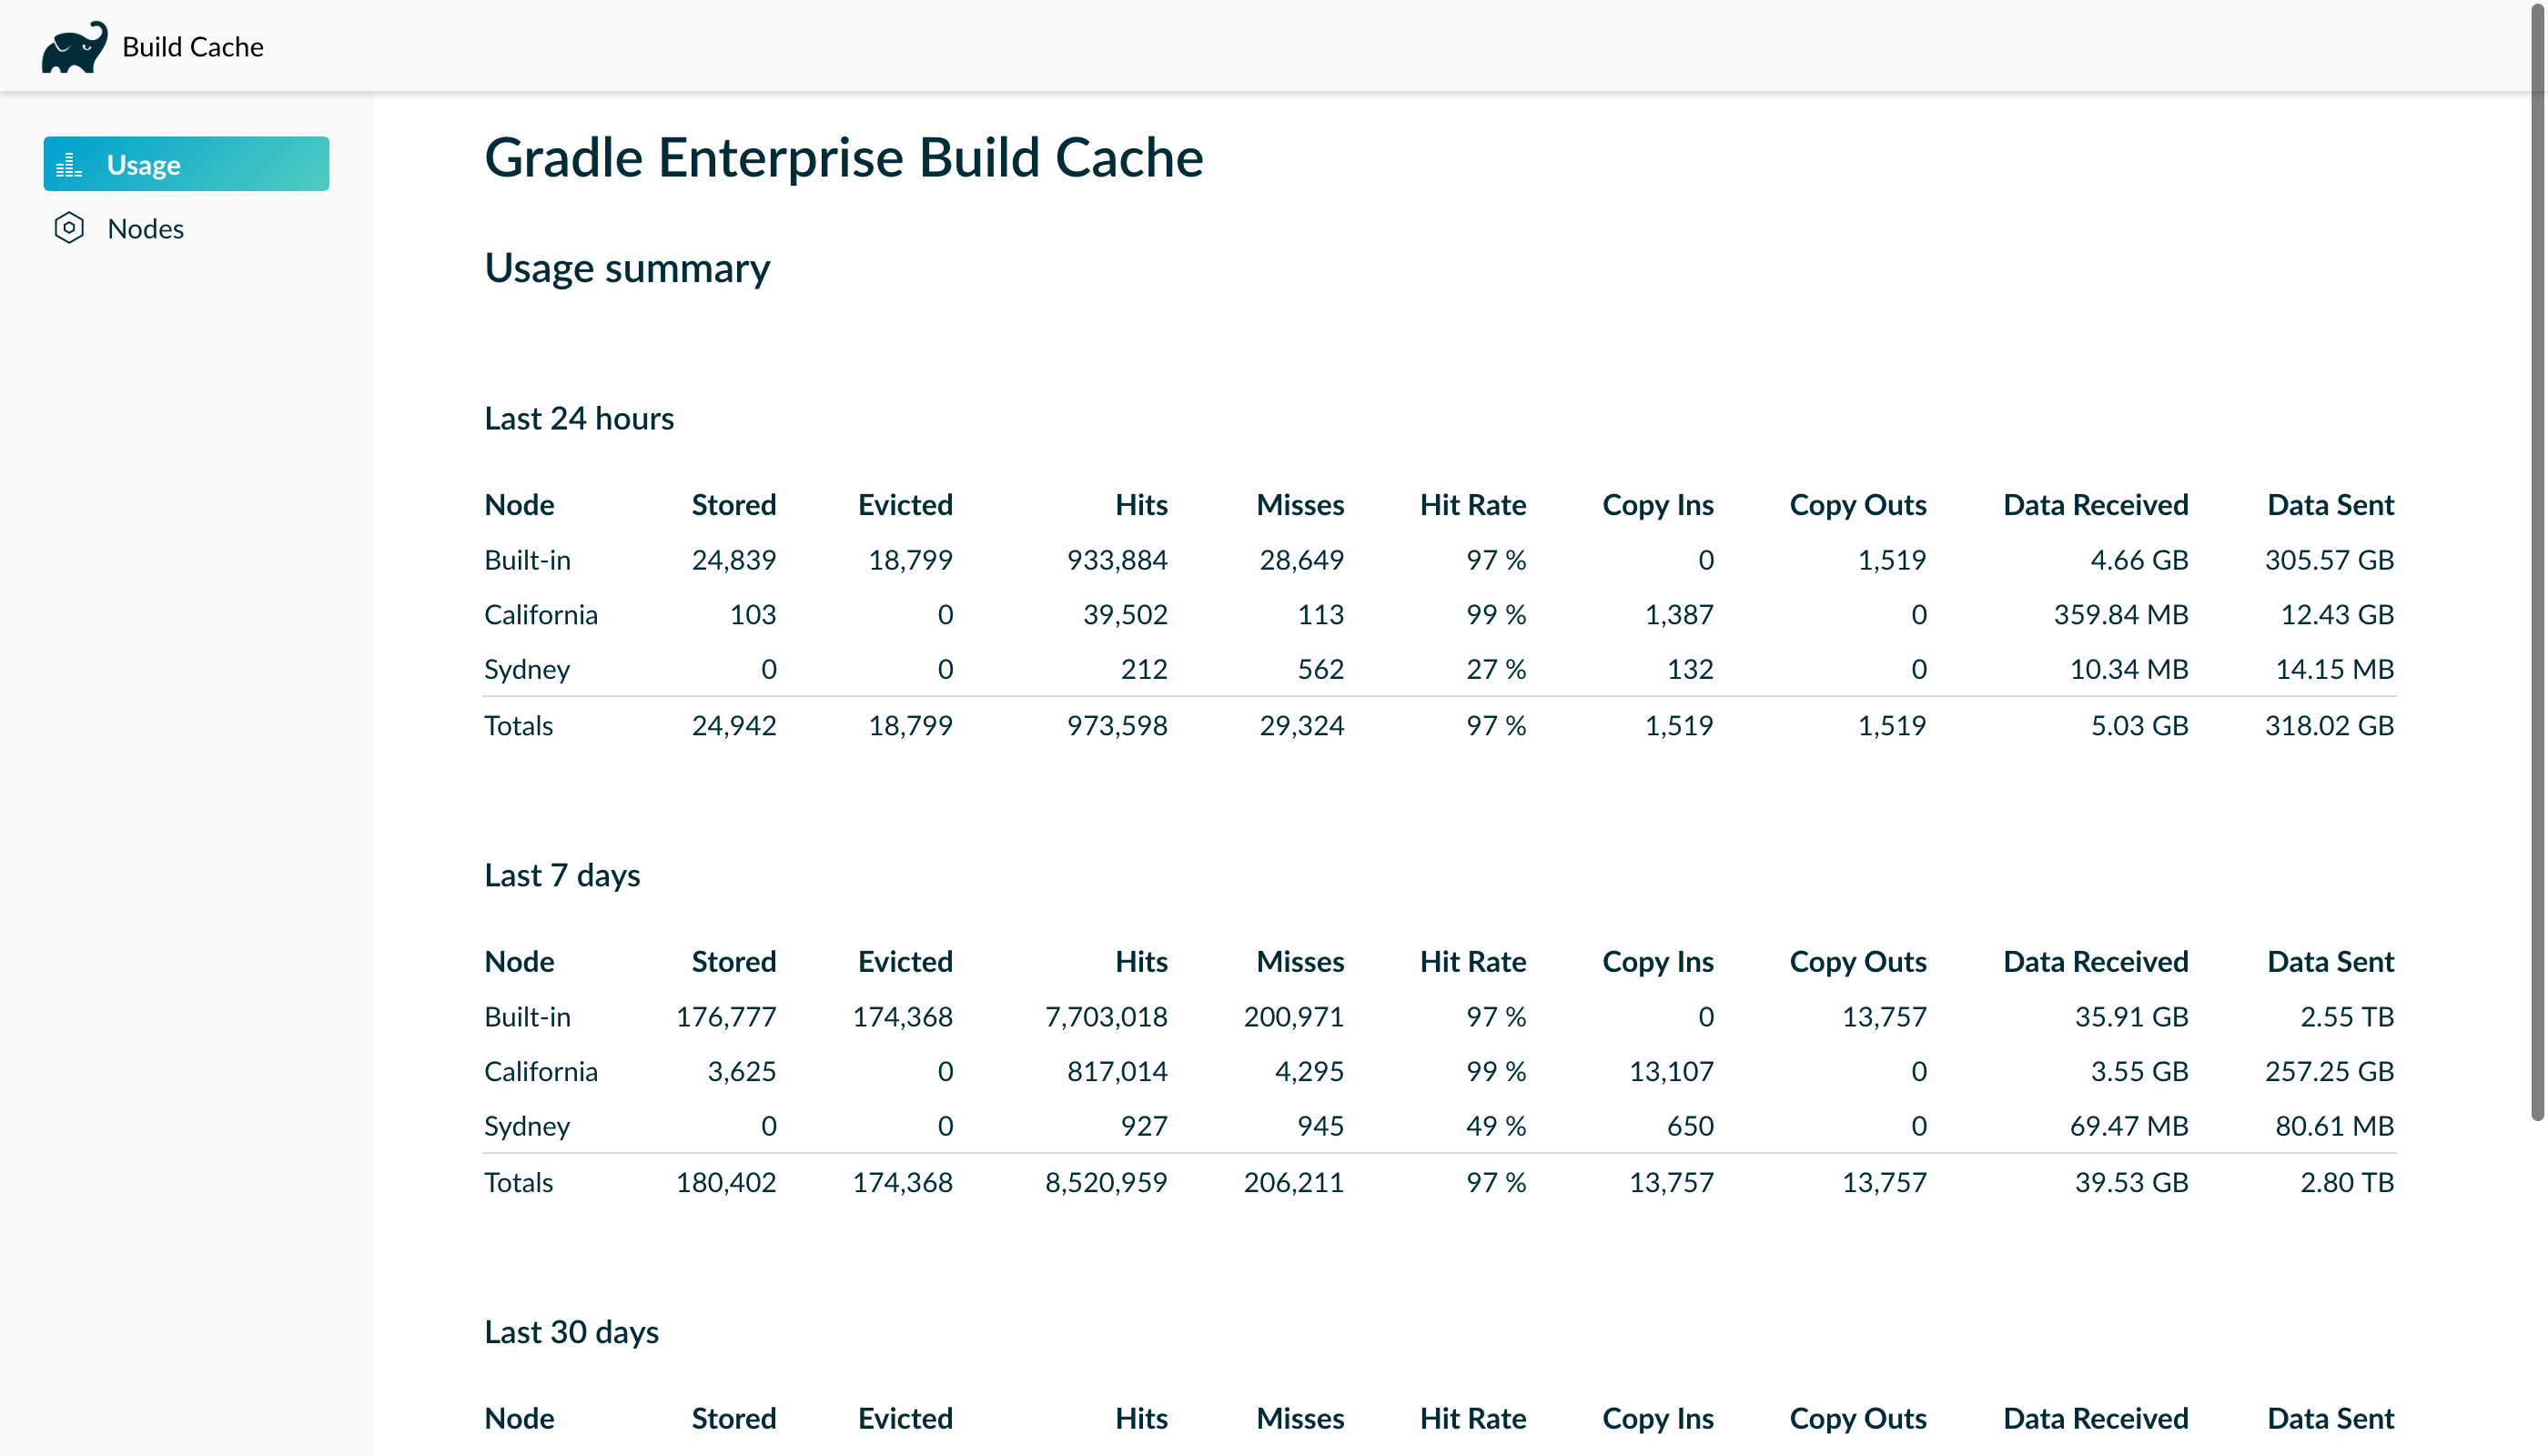
When using the Develocity build cache backend you should pay close attention to the hit rate in the admin UI. A rise in the hit rate there probably indicates better usage by developers:
Analyzing performance in Build Scan
A Build Scan provides a summary of all cache operations for a build via the "Build cache" section of the "Performance" page.
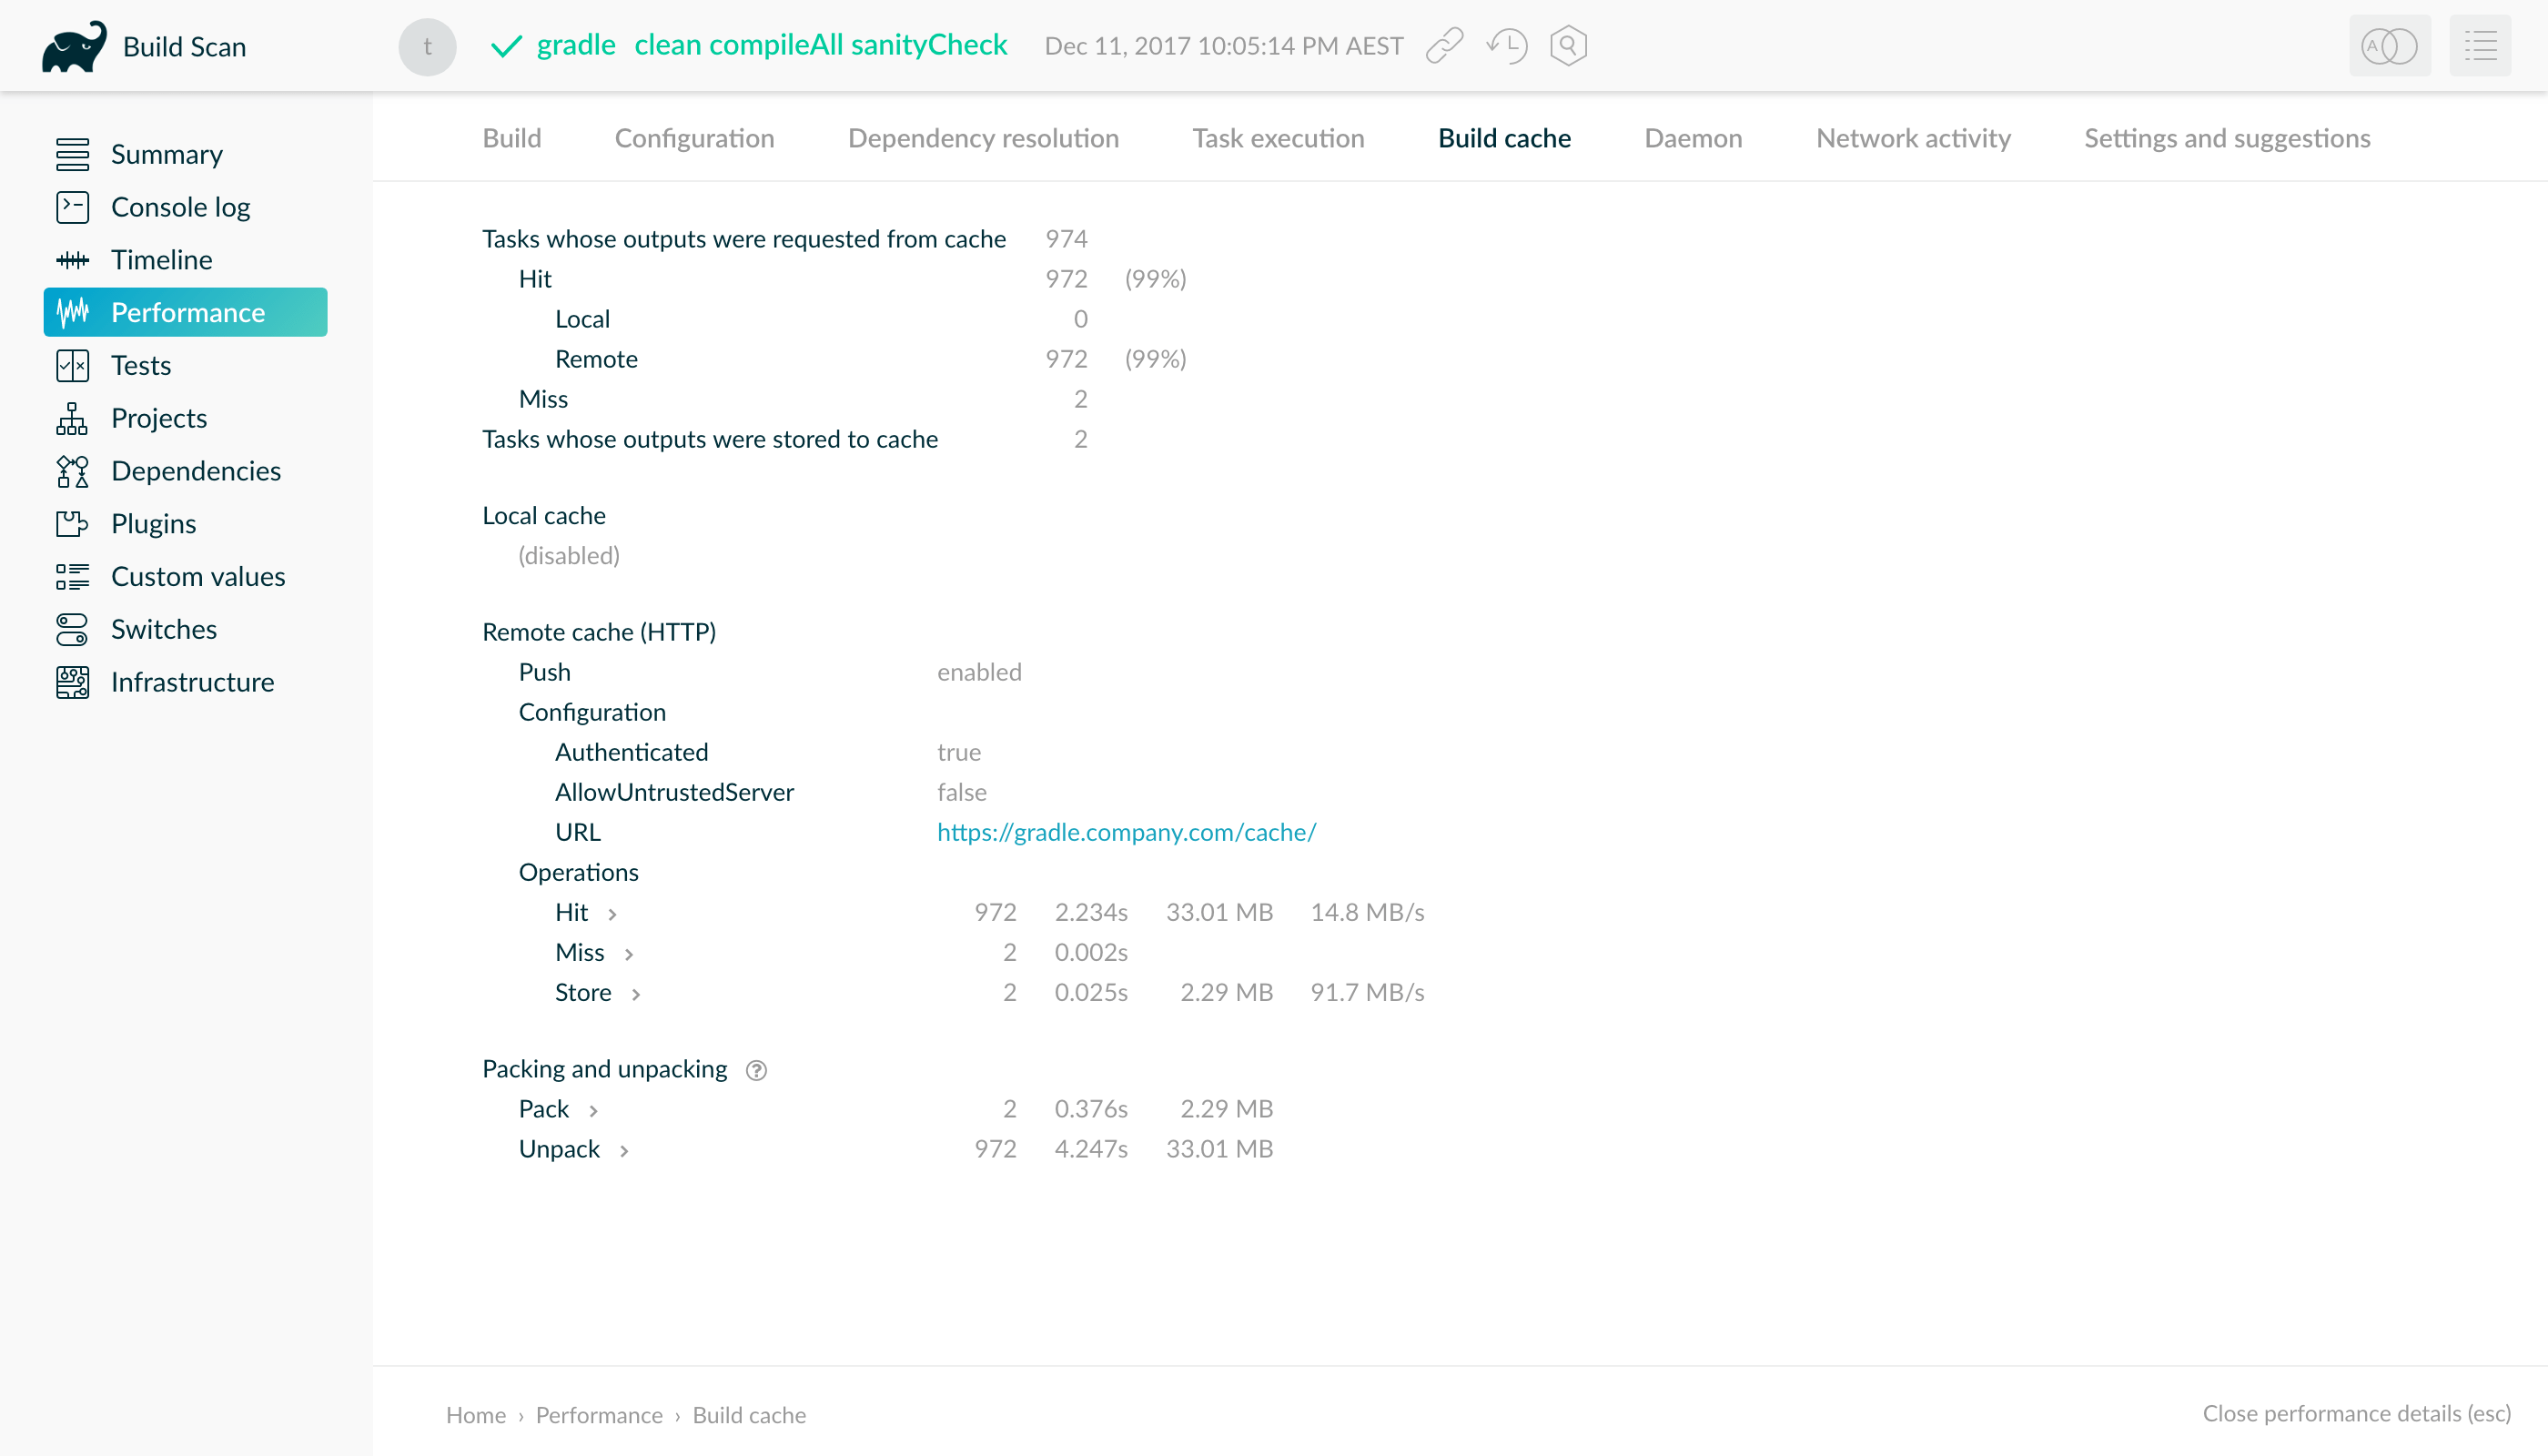
This page details which tasks were able to be avoided by cache hits, and which missed. It also indicates the hits and misses for the local and remote caches individually. For remote cache operations, the time taken to transfer artifacts to and from the cache is given, along with the transfer rate. This is particularly important for assessing the impact of network link quality on performance, as transfer times contribute to build time.
Remote cache performance
Improving the network link between the build and the remote cache can significantly improve build cache performance. How to do this depends on the remote cache in use and your network environment.
The multi-node remote build cache provided by Develocity is a fast and efficient, purpose built, remote build cache. In particular, if your development team is geographically distributed, its replication features can significantly improve performance by allowing developers to use a cache that they have a good network link to. See the "Build Cache Replication" section of the Develocity Admin Manual for more information.