Troubleshooting builds
This page covers how to diagnose failing builds, installation problems, slow builds, and IDE and daemon issues.
Troubleshooting build failures
When a build fails, Gradle prints a failure report at the end of the console output. Read the report first. If it doesn’t explain the failure, add detail with command-line options or publish a Build Scan.
Reading the failure report
The following build registers a packageApp task:
tasks.register("packageApp") {
    doLast {
        println("Packaging the app")
    }
}tasks.register('packageApp') {
doLast {
println 'Packaging the app'
}
}Running it with a misspelled task name fails with this report:
$ ./gradlew pakageAppFAILURE: Build failed with an exception.
* What went wrong:
Task not found
Task 'pakageApp' not found in root project 'task-not-found'. Some candidates are: 'packageApp'.
* Try:
> Run gradle tasks to get a list of available tasks.
> For more on name expansion, please refer to https://docs.gradle.org/0.0.0/userguide/command_line_interface.html#sec:name_abbreviation in the Gradle documentation.
> Run with --stacktrace option to get the stack trace.
> Run with --info or --debug option to get more log output.
> Run with --scan to get full insights from a Build Scan (powered by Develocity).
> Get more help at https://help.gradle.org.
BUILD FAILED in 0sThe report has up to three parts, plus an Exception is section when you run with --stacktrace:
Where-
The build script and line number that caused the failure. Gradle only shows this part when it can trace the failure to a line in a script, so the report above doesn’t have it.
What went wrong-
The error message. For a reported problem, Gradle shows the problem’s name, then its message and details indented on the following lines. When one failure wraps another, the underlying cause is prefixed with
>. A message that starts withExecution failed for taskmeans the failure happened while running that task, not while configuring the build. Try-
Suggested next steps. Gradle and plugins can add suggestions specific to the failure. In the report above, the first two suggestions are specific to the missing task. When a reported problem includes its own solution, Gradle shows that solution and omits the
--stacktrace, logging, and help.gradle.org suggestions.
If you run with --continue and several tasks fail, the report starts with Build completed with N failures. and lists each failure separately.
Getting more detail in the console
Add these options to the failing command to get more information:
--stacktraceor-s-
Adds the stack trace to the report, in an
Exception issection. Use this option first; the stack trace usually points to the failing code. --infoor--debug-
Increases the log level so you can see what Gradle and your build logic did before the failure.
--debugoutput is very large and can expose sensitive information.
$ ./gradlew build --stacktraceTo always print stack traces, set org.gradle.logging.stacktrace=all in gradle.properties.
See stacktrace options for details.
Investigating failures with Build Scan
A Build Scan records the failure together with the context you need to diagnose it.
Add --scan to the failing command:
$ ./gradlew build --scanGradle publishes the Build Scan when the build finishes, including when it fails, and prints a link to it. The Build Scan includes:
-
Each failure with its full stack trace, whether or not you ran with
--stacktrace. -
The console log, so you don’t need to rerun the build to see output that scrolled away.
-
The tasks that ran, their outcomes, and the order they ran in.
-
Test results, including which tests failed.
-
The build environment: Gradle version, JDK, operating system, and build options such as parallel execution or the configuration cache.
The build environment details help when a build fails on CI but passes locally: publish a Build Scan from each and compare their environments.
A Build Scan link also replaces copying error messages and environment details when you ask for help. On scans.gradle.com, anyone with the link can see the console log and build environment, so check what a Build Scan captures before you share it.
If your organization runs a Develocity server, publish to it with --develocity-url as described in Enable Build Scan.
When the Develocity Gradle plugin is already applied to your build, Gradle doesn’t show the --scan suggestion in the failure report.
For failures that recur across many builds, Develocity Failure Analytics groups similar failures together.
Checking the Problems report
If build logic reported problems through the Problems API, Gradle writes an HTML Problems report to build/reports/problems/problems-report.html and prints its location in the console.
The report groups problems by category and can include details and suggested solutions that the failure report doesn’t show.
Finding the phase that fails
Gradle configures the build before it runs any tasks.
To check whether a failure comes from configuration, run the help task:
$ ./gradlew helpThe help task does no work of its own, so if it fails, the problem is in your build scripts, settings, init scripts, or plugins.
If help succeeds, the failure happens while running one of the tasks you requested.
See build phases for how Gradle configures and runs a build.
Troubleshooting the installation
If you followed the installation instructions, and can’t run your Gradle build, try the following.
If you installed Gradle outside of just invoking the Gradle Wrapper, you can check your Gradle installation by running gradle --version in a terminal.
You should see something like this, followed by details about the Gradle build, the JVM, and your operating system:
$ gradle --version------------------------------------------------------------
Gradle {gradleVersion}
------------------------------------------------------------If not, here are some things you might see instead.
Command not found: gradle
If you get "command not found: gradle", add the Gradle bin directory to your PATH.
JAVA_HOME is set to an invalid directory
If you get an error like:
ERROR: JAVA_HOME is set to an invalid directory: /path/to/javaSet the JAVA_HOME variable in your environment to match the location of your Java installation:
$ export JAVA_HOME=/Users/user/Library/Java/JavaVirtualMachines/corretto-22.0.1/Contents/Home
$ echo $JAVA_HOME/Users/user/Library/Java/JavaVirtualMachines/corretto-22.0.1/Contents/HomeMake sure that a Java Development Kit version 17 or higher is properly installed, the JAVA_HOME environment variable is set, and Java is on your PATH.
Permission denied
If you get "permission denied", Gradle is likely in the correct place but isn’t executable.
On Linux and macOS, fix this with chmod +x path/to/executable.
Other installation failures
If gradle --version works, but all of your builds fail with the same error, one of your build scripts may be broken.
See Finding the phase that fails to check whether the failure comes from configuration.
Debugging dependency resolution
In a Build Scan, you can see a dependency tree and see which resolved dependency versions differed from what was requested by clicking the Dependencies view and using the search functionality, specifying the resolution reason.
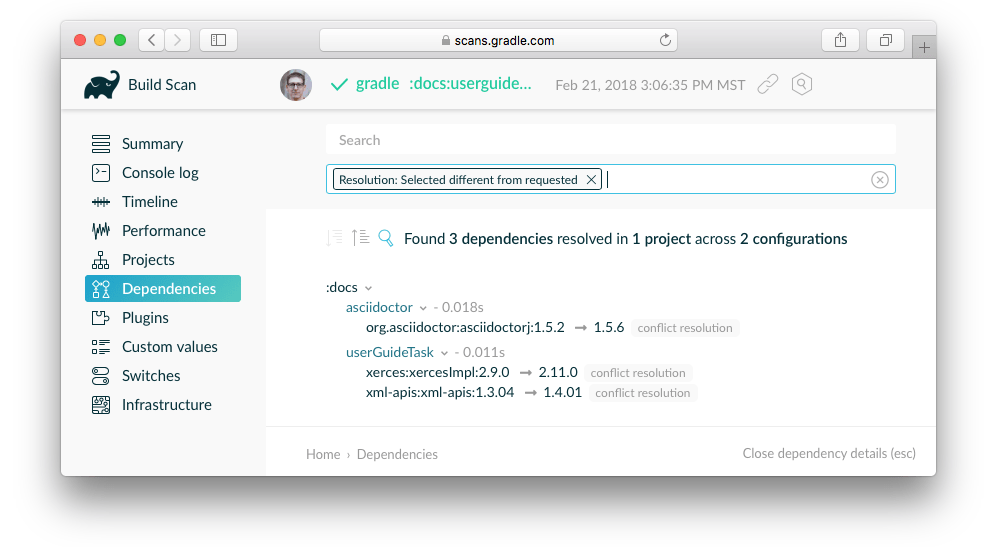
The actual Build Scan with these filters applied is available to explore.
Troubleshooting slow builds
For build performance issues (including "slow sync time"), see improving the Performance of Gradle Builds.
Android developers can find Android-specific tips in the Android Studio user guide on optimizing build speed.
Debugging build logic
Attaching a debugger to your build
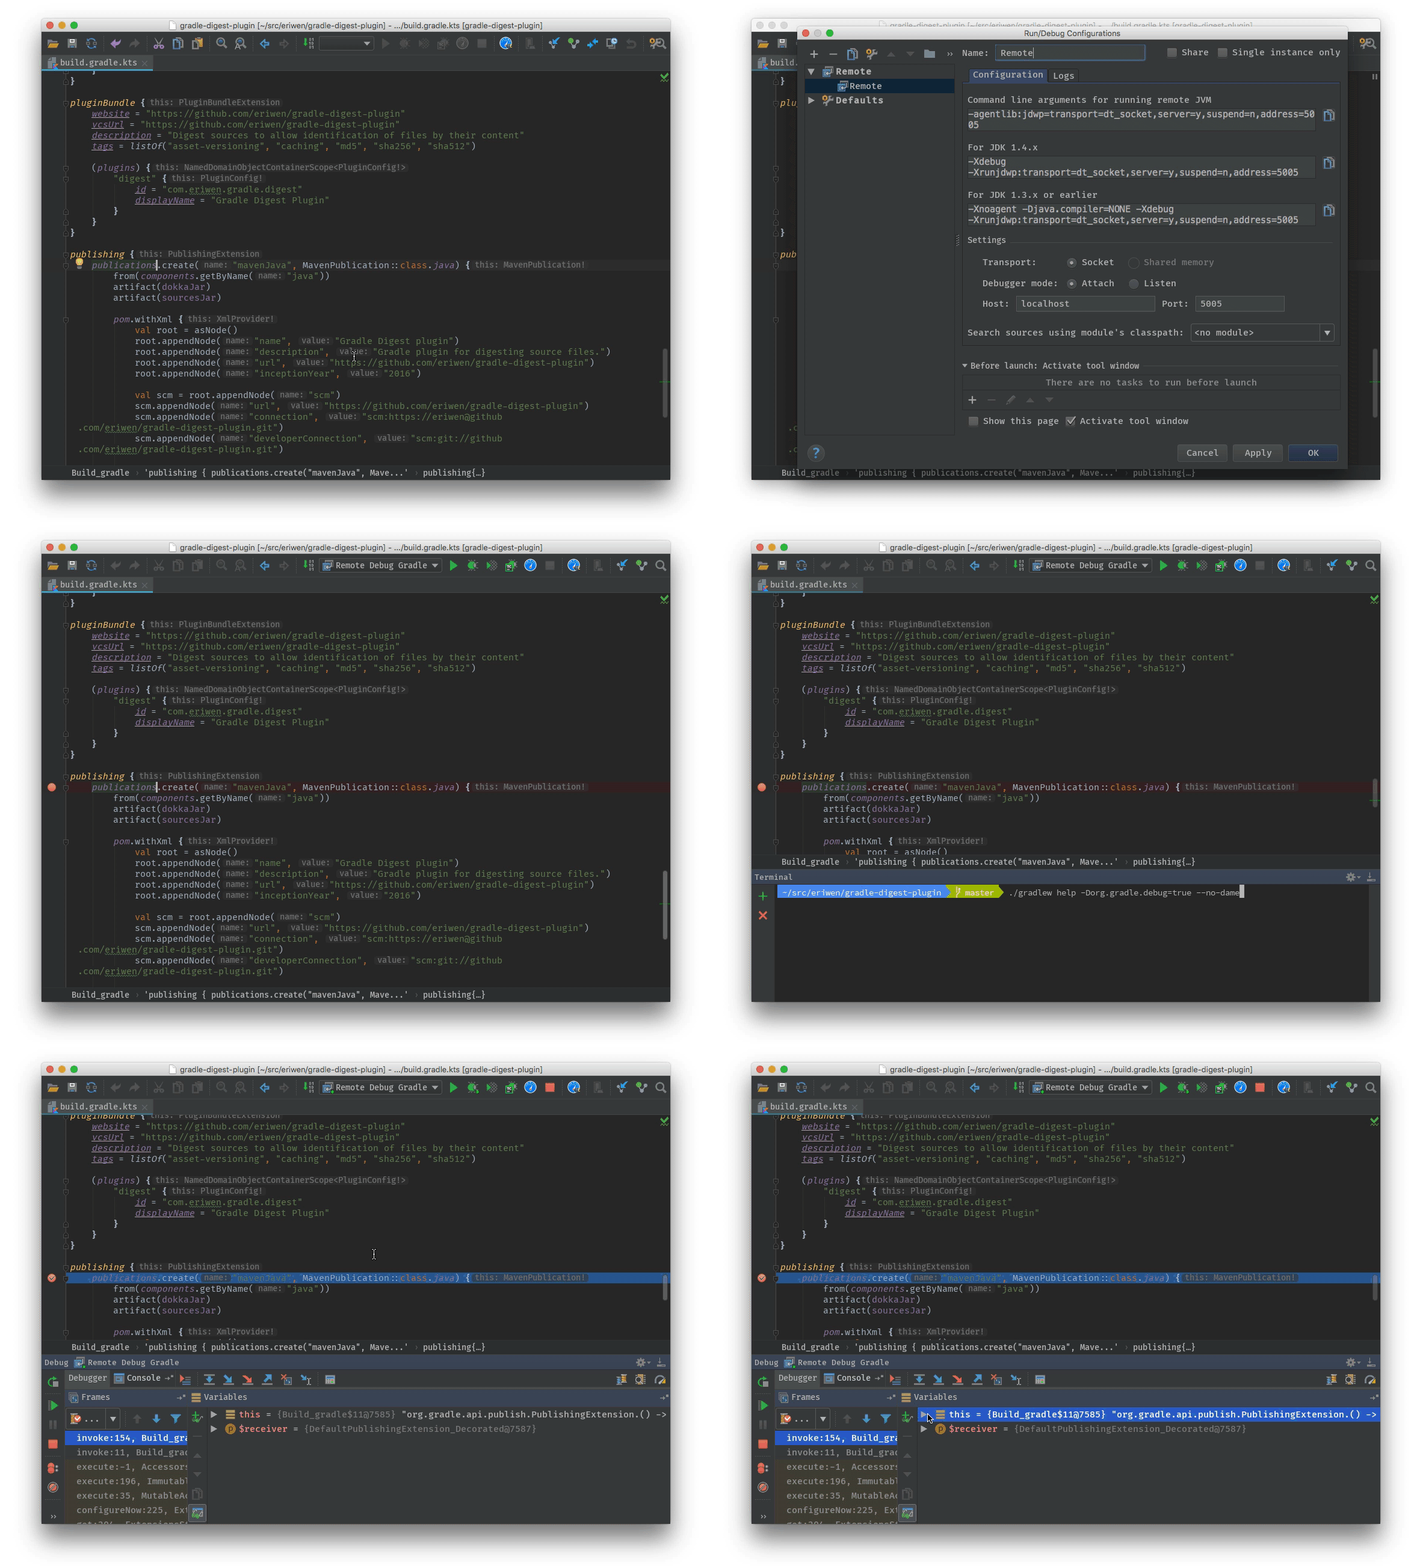
You can set breakpoints and debug buildSrc and standalone plugins in your Gradle build itself by setting the org.gradle.debug property to "true" and then attaching a remote debugger to port 5005.
You can change the port number by setting the org.gradle.debug.port property to the desired port number.
To attach the debugger remotely over the network, set the org.gradle.debug.host property to the machine’s IP address or * (listen on all interfaces).
$ ./gradlew help -Dorg.gradle.debug=trueUsing the Kotlin DSL, you can debug the build scripts themselves.
The following video demonstrates how to debug an example build using IntelliJ IDEA.
Adding and changing logging
In addition to controlling logging verbosity, you can also control display of task outcomes (for example, "UP-TO-DATE") in lifecycle logging using the --console=verbose flag.
You can also control logging from external tools, making them more verbose to debug their execution.
The Gradle Daemon writes additional logs to $GRADLE_USER_HOME/daemon/9.9.0/.
|
Task executed when it should have been UP-TO-DATE
--info logs explain why a task was executed, though a Build Scan does this in a searchable, visual way by going to the Timeline view and clicking on the task you want to inspect.
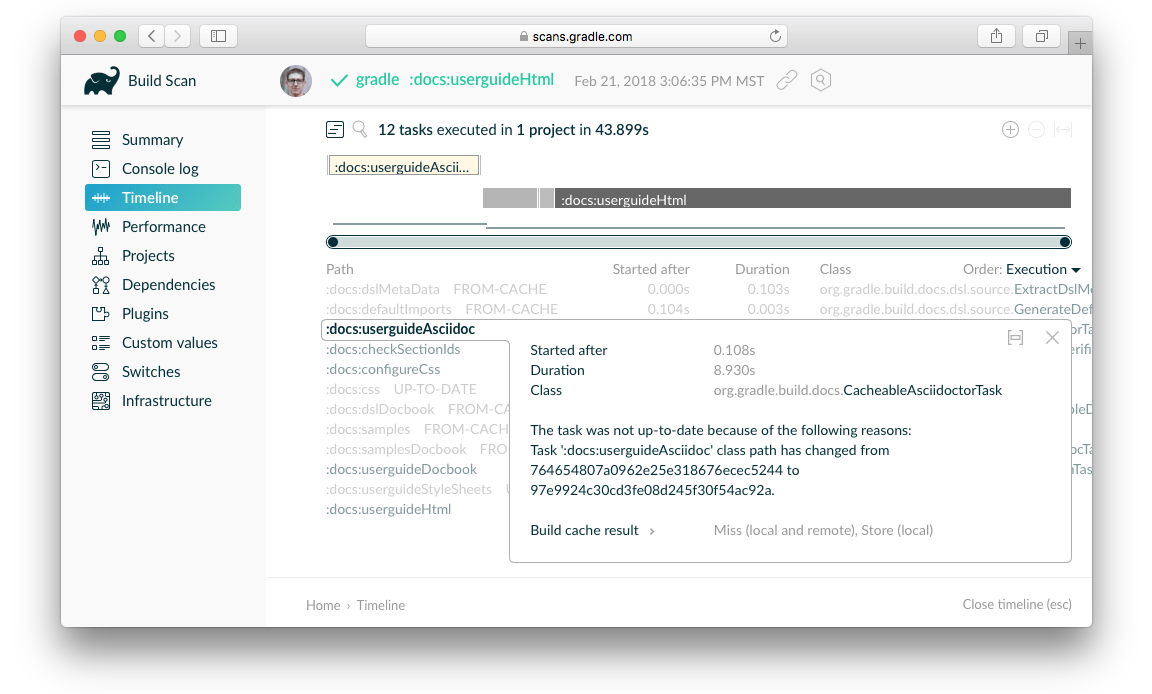
You can learn what the task outcomes mean from this listing.
Debugging IDE integration
Refreshing (syncing) the Gradle project fixes many intermittent IDE errors. For more on working with Gradle, see the documentation in IntelliJ IDEA and in Eclipse.
Refreshing IntelliJ IDEA
| This only works for Gradle projects linked to IntelliJ. |
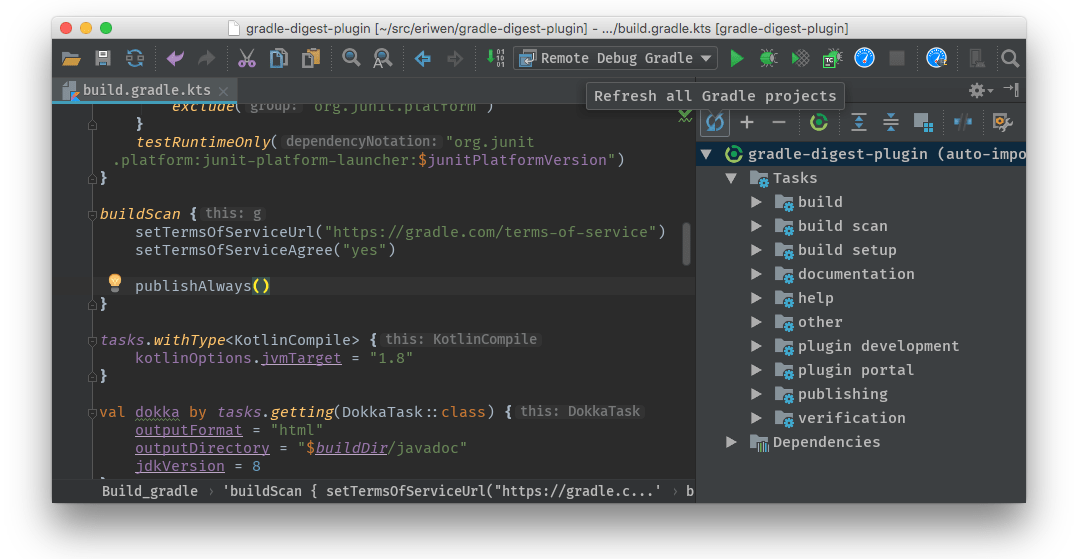
From the main menu, go to View > Tool Windows > Gradle.
Then click the Sync All Gradle Projects button on the tool window’s toolbar.
Refreshing Eclipse (using Buildship)
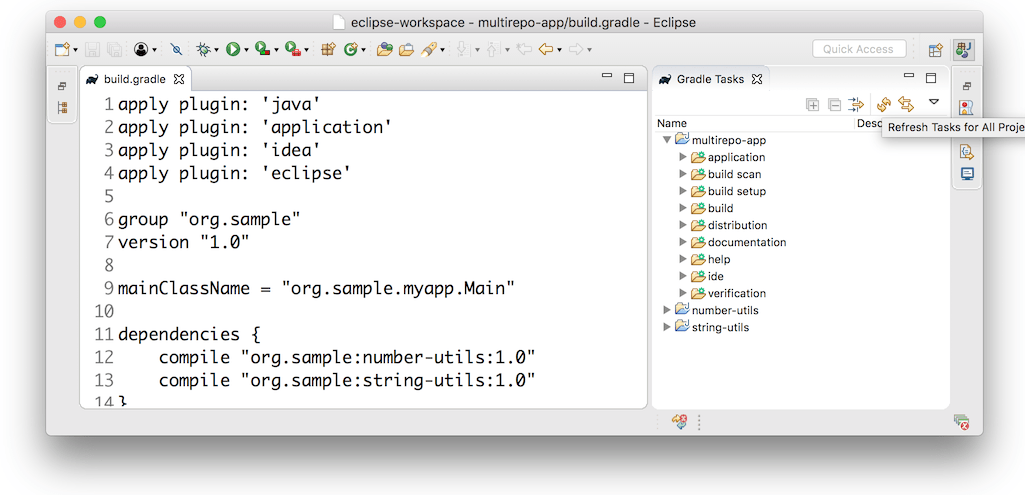
If you’re using Buildship for the Eclipse IDE, you can re-synchronize your Gradle build by opening the "Gradle Tasks" view and clicking the "Refresh" icon, or by executing the Gradle > Refresh Gradle Project command from the context menu while editing a Gradle script.
Troubleshooting daemon connection issues
If your Gradle build fails before running any tasks, you may be encountering network configuration problems. When Gradle is unable to communicate with the Gradle Daemon process, the build fails immediately with a message similar to this:
$ ./gradlew helpStarting a Gradle Daemon, 1 stopped Daemon could not be reused, use --status for details
FAILURE: Build failed with an exception.
* What went wrong:
A new daemon was started but could not be connected to. This is unexpected.
diagnostics: DaemonInfo{pid=55913, address=[7fb34c82-1907-4c32-afda-888c9b6e2279 port:42751, addresses:[/127.0.0.1]], state=Busy, ...This can occur when network address translation (NAT) masquerade is used. When NAT masquerade is enabled, connections that should be considered local to the machine are masked to appear from external IP addresses. Gradle refuses to connect to any external IP address as a security precaution.
The solution to this problem is to adjust your network configuration such that local connections are not modified to appear as from external addresses.
You can monitor the detected network setup and the connection requests in the daemon log file ($GRADLE_USER_HOME/daemon/<Gradle version>/daemon-<PID>.out.log).
2021-08-12T12:01:50.755+0200 [DEBUG] [org.gradle.internal.remote.internal.inet.InetAddresses] Adding IP addresses for network interface enp0s3
2021-08-12T12:01:50.759+0200 [DEBUG] [org.gradle.internal.remote.internal.inet.InetAddresses] Is this a loopback interface? false
2021-08-12T12:01:50.769+0200 [DEBUG] [org.gradle.internal.remote.internal.inet.InetAddresses] Adding remote address /fe80:0:0:0:85ba:3f3e:1b88:c0e1%enp0s3
2021-08-12T12:01:50.770+0200 [DEBUG] [org.gradle.internal.remote.internal.inet.InetAddresses] Adding remote address /10.0.2.15
2021-08-12T12:01:50.770+0200 [DEBUG] [org.gradle.internal.remote.internal.inet.InetAddresses] Adding IP addresses for network interface lo
2021-08-12T12:01:50.771+0200 [DEBUG] [org.gradle.internal.remote.internal.inet.InetAddresses] Is this a loopback interface? true
2021-08-12T12:01:50.771+0200 [DEBUG] [org.gradle.internal.remote.internal.inet.InetAddresses] Adding loopback address /0:0:0:0:0:0:0:1%lo
2021-08-12T12:01:50.771+0200 [DEBUG] [org.gradle.internal.remote.internal.inet.InetAddresses] Adding loopback address /127.0.0.1
2021-08-12T12:01:50.775+0200 [DEBUG] [org.gradle.internal.remote.internal.inet.TcpIncomingConnector] Listening on [7fb34c82-1907-4c32-afda-888c9b6e2279 port:42751, addresses:[localhost/127.0.0.1]].
...
2021-08-12T12:01:50.797+0200 [INFO] [org.gradle.launcher.daemon.server.DaemonRegistryUpdater] Advertising the daemon address to the clients: [7fb34c82-1907-4c32-afda-888c9b6e2279 port:42751, addresses:[localhost/127.0.0.1]]
...
2021-08-12T12:01:50.923+0200 [ERROR] [org.gradle.internal.remote.internal.inet.TcpIncomingConnector] Cannot accept connection from remote address /10.0.2.15.
Getting additional help
If you didn’t find a fix for your issue here, ask the Gradle community on the Gradle forum or join our Community Slack Channel.
If you believe you’ve found a bug in Gradle, file an issue on GitHub.